
To easily view user retention and returning visitor data, leverage analytics tools like Google Analytics or Mixpanel. These platforms provide detailed reports that help you understand how often visitors come back and how long they stay engaged. Simply set up your tracking code, and you’ll gain clear insights into user loyalty and behavior.
In short, tracking user retention and returning visitors involves choosing the right analytics platform, installing tracking codes, and analyzing specific reports such as cohort analysis or audience overview. This allows you to understand customer engagement better and tailor your strategies accordingly.
If you’re aiming to improve your website’s performance, knowing how to monitor these key metrics is essential. By analyzing user return rates and retention data, you can identify what keeps visitors engaged and what may need improvement, ultimately boosting your growth and success.

How to view user retention and returning visitor data
Understanding how users behave on your website or app is crucial for growth. Tracking user retention shows how well you keep visitors coming back over time. Returning visitor data helps you see which users are loyal and engaged with your content or products.
What is user retention?
User retention measures the percentage of visitors who come back after their first visit. It shows how many users stay engaged with your site or app over specific periods. High retention rates mean users find value and want to return regularly.
Why is user retention important?
Retention indicates the health of your business. It impacts revenue, conversion rates, and customer lifetime value. When users keep returning, it reduces the need for constant new user acquisition, saving marketing costs.
How to track user retention effectively
To analyze retention, you need the right tools and data. Use analytics platforms that track user behavior from their first visit to subsequent sessions. Consistently monitor retention metrics to identify trends and issues.
Key retention metrics to monitor
- Day 1 retention: Percentage of users returning the next day.
- Week 1 retention: Users coming back within the first week.
- Month 1 retention: Users who return within the first month.
- Long-term retention: Users returning after 3, 6, or 12 months.
Tools to view user retention data
Several tools can help you analyze retention. Google Analytics and Mixpanel are popular options that provide detailed reports. Many platforms offer customizable dashboards to visualize data easily.
Google Analytics
Google Analytics allows you to set up cohorts to see how different groups of users behave over time. You can view retention rates and compare segments based on acquisition channels, device types, or locations.
Mixpanel
Mixpanel offers advanced cohort analysis with real-time data. You can track specific user actions and see how they influence retention. Its intuitive interface makes it easy to identify patterns and trends.
How to interpret retention data
Interpreting data requires understanding what the numbers mean for your business. A high Day 1 retention might indicate your onboarding process is effective. Low retention after a few days suggests a need for better engagement strategies.
Benchmarking your retention rates
Compare your retention metrics against industry averages. For example, e-commerce sites may expect around 20-30% Day 7 retention. SaaS products often aim for higher long-term retention rates.
Strategies to improve user retention
Once you understand your retention metrics, you can implement methods to boost them. Focus on creating engaging content, providing excellent customer service, and offering personalized experiences.
Enhancing onboarding processes
Make sure new users understand how to use your product quickly. Use tutorials, walkthroughs, and clear calls-to-action to guide them effectively.
Personalization and targeted communication
Send tailored messages based on user behavior. Personalized emails and notifications encourage ongoing engagement and remind users of your value.
Understanding returning visitor data
Returning visitor data shows how many users visit your site multiple times. It indicates loyalty and interest level. Tracking this data helps you identify your most engaged audience segments.
Key metrics for returning visitors
- Percentage of returning visitors: The ratio of returning to new visitors.
- Frequency of visits: How often users come back within a specific period.
- Average session duration: How long returning visitors stay.
How to find returning visitor data in analytics tools
Most analysis platforms automatically segment returning visitors from new ones. In Google Analytics, you can see this data in the Audience Overview report. Mixpanel and others also provide detailed breakdowns.
Segmenting returning visitors
Create segments based on visit frequency, recency, and engagement actions. This helps you tailor your marketing efforts to retain these users longer.
Leveraging returning visitor data to boost engagement
Use insights from returning visitor data to refine your strategies. For instance, identify which channels bring back loyal users. Use that information to optimize your marketing campaigns.
Personalized offers and content
Send special discounts or content to returning visitors. This encourages continued loyalty and increases their lifetime value.
Retargeting campaigns
Set up retargeting ads to re-engage visitors who haven’t returned in a while. Use tailored messaging based on their previous interactions.
Integrating user retention and returning visitor data in your strategy
Combining these insights offers a complete view of user behavior. When you analyze retention alongside returning visitor patterns, you identify what keeps users engaged long-term.
Creating a feedback loop
Regularly review your data and adjust your content, features, or communication channels. Continuous improvement leads to higher retention and more returning visitors.
Reporting and sharing insights
Generate clear reports to share findings with your team. Use visualizations like charts and tables for an easier understanding of trends and opportunities.
Tracking user retention and returning visitor data provides vital insights for your business growth. Use the right tools to measure these metrics, interpret the results carefully, and implement actionable strategies. Keeping users engaged and loyal is an ongoing process that depends on understanding their behavior and adapting your approach.
Customer Retention & Cohort Analysis | How VCs Calculate Customer Retention
Frequently Asked Questions
What metrics should I focus on to analyze user retention effectively?
To analyze user retention effectively, track metrics such as the retention rate over specific time periods (daily, weekly, monthly), the number of returning visitors, and engagement levels like session duration and page views per visit. These indicators help you understand how well your content encourages users to come back and stay engaged with your site over time.
How can I access historical data on returning visitors within analytics tools?
Most analytics platforms provide filters or date range selectors that allow you to view historical data. By selecting customized date ranges, you can compare returning visitor metrics across different periods. Additionally, some tools offer segmentation features that help isolate returning visitors from new ones for more detailed insights.
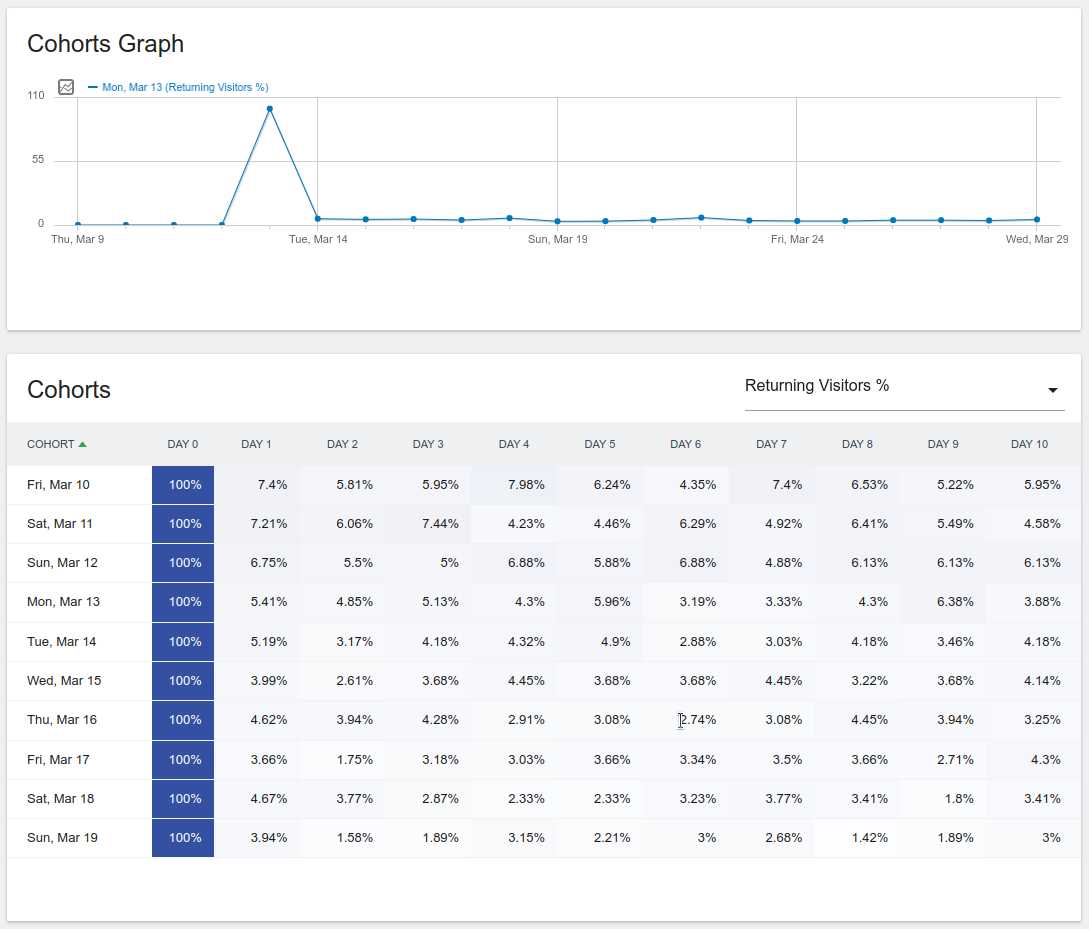
What methods are available to visualize user retention trends?
You can utilize line graphs, cohort analysis charts, and heatmaps within your analytics dashboard to visualize user retention trends. These visualizations display how user engagement evolves over time, highlight periods of increased or decreased activity, and help identify patterns related to user behavior and content performance.
How can I identify segments of users with high retention rates?
Use segmentation features in your analytics tools to break down your user base by demographics, sources, device types, or behavior. Analyzing these segments reveals which groups tend to return more frequently and engage longer, allowing you to tailor marketing efforts or content strategies to retain those users better.
What steps should I take if I notice a decline in returning visitors?
Investigate potential causes such as changes in content, website performance issues, or shifts in marketing campaigns. Review recent updates or modifications to your site, analyze user feedback, and compare traffic sources during the decline period. Implement targeted measures like content optimization or improved user experience to encourage repeat visits and boost retention.
Final Thoughts
To view user retention and returning visitor data, navigate to your analytics dashboard. Use the appropriate reports or segments to focus on user behavior over specific periods. Applying filters helps you identify patterns and measure engagement over time.
Understanding these metrics offers valuable insights into your audience’s loyalty and content effectiveness. Reviewing this data regularly enables you to make informed decisions for your marketing strategy.
How to view user retention and returning visitor data is straightforward once you know where to look. Analyzing these figures helps you improve user experience and grow your site’s reach.
Recommended SEO


